Content
Double Stars - A short introduction
Measurement of separation and position angle with small telescopes
Version : 1.2
Author  : H.Wichmann
Date    : 04.09.2026
License : CC BY 4.0
Content
Double Stars - A short introduction
Measurement of separation and position angle with small telescopes
This article describes the Double Star Calculator (DSCALC) and its additional tools, including its usage, input data, and results.
The Double Star Calculator processes GAIA data records of two nearby stars, computes various results based on these records, and assesses the likelihood of the pair being a common proper motion (CPM) pair, a Co-Moving pair, a physical pair, or an optical pair. The Double Star Calculator – Orbital Elements generates orbit diagrams and a corresponding ephemeris table showing the separation and position angle of a double star, based on given orbital elements. The Double Star Calculator – Orbit Determination processes historical measurements of separation and position angle of a double star and attempts to determine its orbital elements. The Double Star Calculator – Convert Date & Time converts a given date and time into Julian Date and Besselian Epoch, and vice versa.
The Double Star Calculator just requires the Gaia DR3 Source-IDs of a pair of close stars as input parameters to calculate various results. Easy ways to obtain the Gaia DR3 Source-IDs are for example from the Aladin Sky Atlas or from Cartes du Ciel / SkyChart.
Use [CLEAR ALL] to empty the input fields and prepare for new Gaia DR3 Source-ID values. Simply enter or copy and paste both Gaia DR3 Source-ID values into the two input fields of the Double Star Calculation tool. After entering the Gaia DR3 Source-IDs, click [SUBMIT DATA] to perform the double star calculations and display the results. Click [RESTORE DEFAULT] to reload the default Gaia DR3 Source-IDs for the double star STF 1872 AB. The GAIA IDs are mandatory parameters. The WDS Discoverer & Number parameter is optional and, if provided, will be used in the generated report to access the USNO Washington Double Star Catalog (WDS) and display the corresponding entry. Additionally, the Observation Date parameter is optional and, if provided, will be used to calculate the separation and position angle of the pair for the corresponding epoch. If a dedicated Observation Date is not given, the current system date will be used instead. Finally, a Start- and an End-Epoch can be defined within the range J1500-J2500. These will be used to calculate the separation and position angle of the pair across this epoch range, based on the proper motion information in the Gaia records.
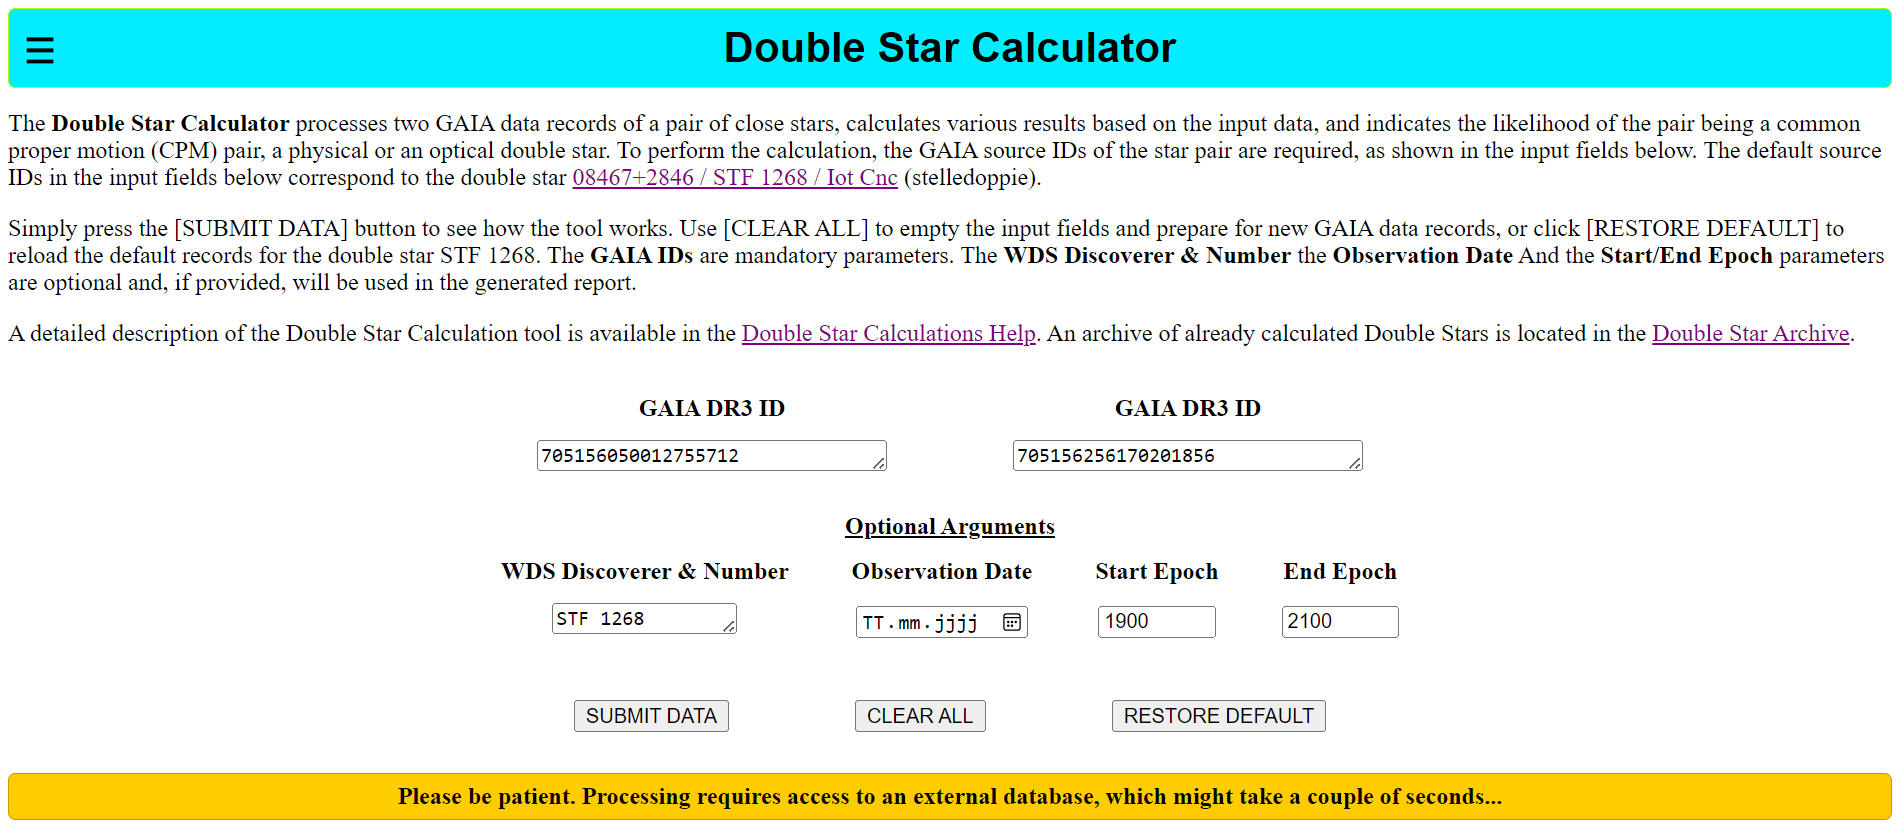
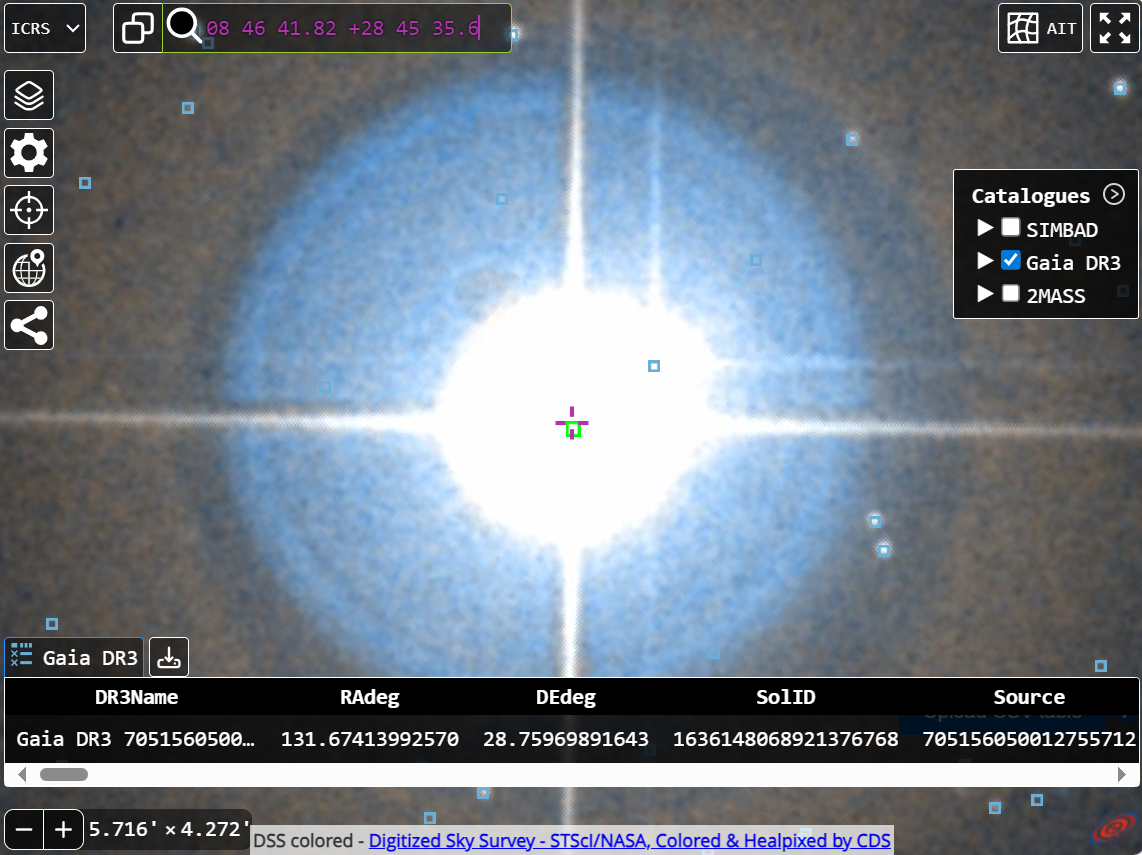
Unfortunately, there seems to be no database available online that provides a mapping between the WDS ID or Discoverer code and the corresponding Gaia DR3 source IDs of a double star. Therefore, this chapter shows an option to retrieve the Gaia DR3 source IDs based on the WDS ID or Discoverer code. The procedure itself is rather simple; the only tricky part is selecting the correct secondary. The procedure listed below is essentially the same when using the desktop version of Aladin.
Let's assume we are looking for the Gaia DR3 IDs of the double star STF 1268:
The Double Star Calculator computes results for a pair of stars based on the selected GAIA data records. Additionally, various parameters are calculated for each star individually. All calculations using GAIA data records are based on Epoch J2016, except for separation and position angle, where additional results are calculated for the specified epoch.
gaiadr3.astrophysical_parameters. Interpretation of the parameters is based on the Gaia DR3: preliminary catalogue data model.
DSC-Combmod binary starStatus Noise Significance Interpretation -------------------------------------------------------------------------------- Very Good < 0.5 < 10 Perfect single-star fit Good / Minor < 1.0 ≥ 10 Minor noise, but negligible for most cases Possible Binary ≥ 1.0 ≥ 10 Significant noise. High Probability of binary or orbital jitter Uncertain ≥ 1.0 < 10 High noise but low statistical reliability
  1.0 – 1.3        : Consistent         - Standard photometry for a single star
  1.0 or 1.3 – 2.0 : Inconsistent       - Potential background contamination or complex sky background
  > 2.0            : Poor / Double Star - Significant excess flux; often a strong indicator of a close binary or an overlapping source
Visibility periods
  < 8 : Unreliable - Insufficient data to guarantee stable parallax or proper motion
  ≥ 8 : High       - Indicates a well-observed star with a robust solution
IPD multi-peak frac
  0%   :   Single peak  - The source appears as a single point
  > 0% : Multiple peaks - Strong indicator of a resolved or partially resolved double star
IDP GoF harmonic amp
  < 0.1     : Unobtrusive        - Consistent with a symmetric single-star source
  0.1 – 0.3 : Slight Structure   - Small deviation from a point source
  0.3 – 1.0 : Partially Resolved - Strong indication of an elongated source or a close pair
  > 1.0     : Double Star        - The source is clearly non-pointlike, highly likely a binary system
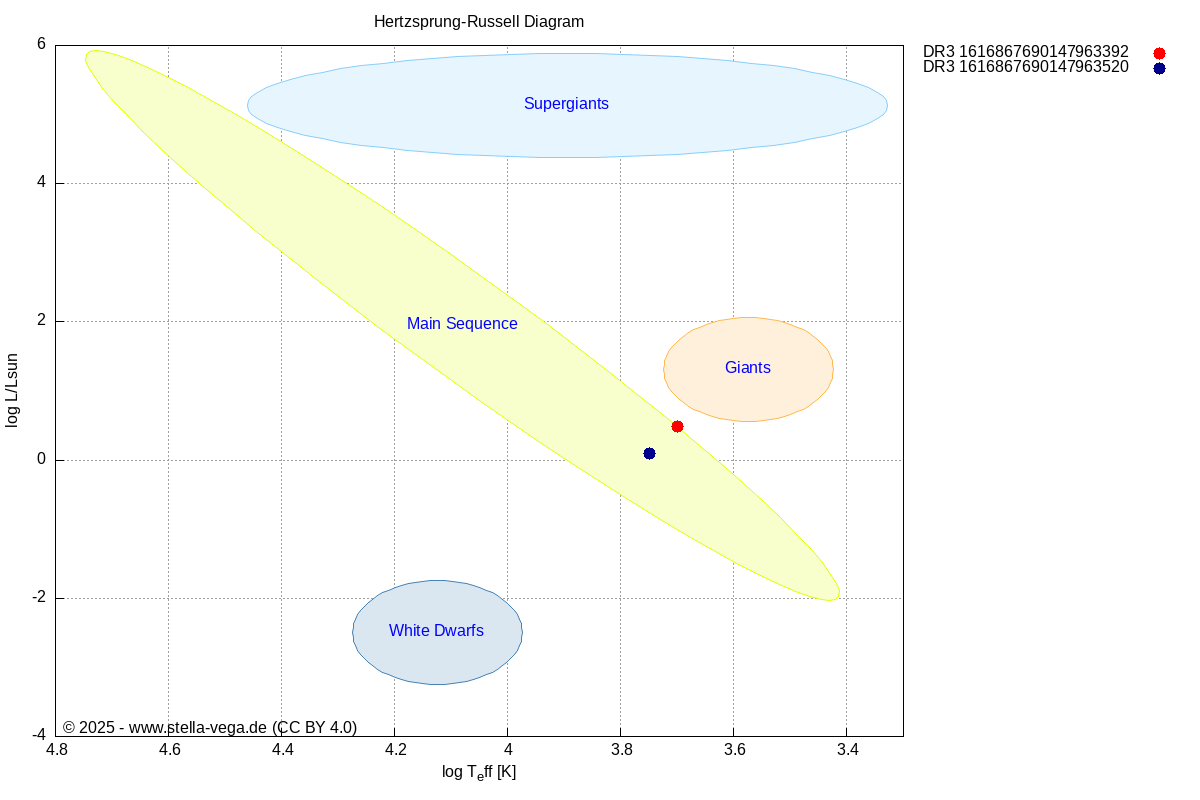
The positions of both components are plotted in a simplified Hertzsprung–Russell diagram (HRD).The positions are either derived from calculated luminosities and effective temperatures (Teff) from the Gaia GSP-Phot Aeneas library (plotted as solid circles) or estimated from the color index (bp_rp) measured by Gaia (plotted as open circles).
Finally, several plausibility calculations are performed to assess whether the examined pair is a physical, co-moving, optical, or CPM pair.
Common Proper Motion
Co-Moving
Binarity
Metallicity Analysis [M/H]
RUWE parameters
The Common Proper Motion indicator:
The likelihood of a stellar pair being a Common Proper Motion (CPM) system is represented via the established method according to Harshaw (JDSO Vol. 12 No. 4, 2016). It calculates a Ratio of Proper Motion (rPM).
    Harshaw rPM              Meaning
    -----------------------------------------------------
    < 0.2                    CPM (Common Proper Motion)
    0.2 - 0.6                SPM (Similar Proper Motion)
    > 0.6                    DPM (Distinct Proper Motion)
Various Co-Moving indicators are calculated:
The likelihood of a stellar pair being a Co-Moving system is represented via Co-Moving Evidence Indicator. This indicator (ranging from 0.0 to 1.0) is derived by converting observed angular motion and radial velocity into a unified 2D/3D velocity vector in km/s. By incorporating parallax data and spatial separation, the calculation accounts for the physical scale and distance of the system, ensuring that the resulting evidence is physically meaningful.
    Co-Mov Evidence-Indicator   Meaning
    ------------------------------------------------------------------------------------
    0.7 – 1.0                   Strong     High probability of co-moving association
    0.3 – 0.7                   Moderate   Potential association
    0.1 – 0.3                   Weak       Low agreement, difference significant
    < 0.1                       Unlikely   Significant discrepancy; association unlikely
The Co-Moving (CoMov) indication uses a fixed velocity cut-off of 5 km/s, implemented with a Gaussian-like function. CoMov pairs are recognized within a radius of 1 parsec (Jacobi radius).
    Indicator                            |        Value    Meaning
    -------------------------------------|-------------------------
    rPM (Harshaw)                        :        0.04     (CPM)

    COMOV: Velocity Evidence Indicator   :        0.77     (Strong)
    COMOV: Distance Evidence Indicator   :        0.98     (Strong)
    Co-Moving Total Evidence Indicator   :        0.87     (Strong)

    rPM/CoMov Agreement                  :        High
In addition, the system evaluates the likelihood of binarity :
Fundamentally, the same Uncertainty-Weighted Likelihood (UWLE) approach is used to indicate a physical, gravitational relationship between the stars. In contrast to the COMOV Evidence indication, different scaling factors are used to estimate the likelihood of binarity. The velocity cut-off is dynamic and based on gravitational scaling, with a benchmark of 2.1 km/s at 1000 au. Potential binaries are recognized by the algorithm within a radius of 20,000 au (Wide Binaries/WBS) and additionally 1,000 au (Tight Binaries/TBS).
To account for different data qualities, the UWLE is applied using either the spatial/3D or the projected/2D separation error. If a potential binary is detected, the estimated orbital period at the lower bound, the escape velocity, and the circular orbital velocity are calculated. Additionally, a Binding Indicator is computed, where < 1 indicates a bound system and > 1 indicates an unbound one.
Additionally, the 3D Spatial Distance Probabilities are calculated using a lower-truncated normal distribution. The 3D separation and its uncertainty are initially modeled as a normal distribution, but values below the projected separation are excluded because they are physically impossible. The remaining distribution is then renormalized to 100%. The resulting probability for each threshold therefore describes the likelihood that the true 3D separation is within the physically possible range from the projected separation up to that threshold.
    Indicator                          :       Value
    ----------------------------------------------------------------------


    Separation, Sigma and Reliability  :
    ===================================
    Projected Separation               :          64     au
    Critical Separation  (d_crit)      :         356     au
    Spatial Separation                 :        5554  ±     2100  au
      1-Sigma Range                    : [      3455,       7654] au
      Significance                     :        2.64     σ
      Note: 3D distance not significantly resolved

    3D Distance Probability Analysis   :
    ===================================
    P(D-3D <=        128 au)           :        0.0      %  (2.0 * D-projected)
    P(D-3D <=        356 au)           :        0.2      %  (D-critical)
    P(D-3D <=       1000 au)           :        1.1      %  (Intermediate)
    P(D-3D <=       2500 au)           :        6.9      %  (Wide binary)
    P(D-3D <=      10000 au)           :       98.3      %  (Wide binary)
    P(D-3D <=      20000 au)           :      100.0      %  (Very wide binary)
    P(D-3D <=      50000 au)           :      100.0      %  (Extremely wide)
    P(D-3D <=     206265 au)           :      100.0      %  (Jacobi radius)


    Proper Motion and Velocity         :
    ===================================
    rPM (Proper Motion Ratio)          :        0.06     (CPM)
    ΔRelative Velocity (3D)            :        2.96  ±  0.06   km/s


    UWLE for Wide Binaries (3D)        :
    ===================================
    WBS: Velocity Evidence Indicator   :        0.00     (Unlikely)
    WBS: Distance Evidence Indicator   :        0.92     (Strong)
    Binarity Total Evidence Indicator  :        0.00     (Unlikely)


    UWLE for Wide Binaries (2D)        :
    ===================================
    WBS: Velocity Evidence Indicator   :        0.88     (Strong)
    WBS: Distance Evidence Indicator   :        1.00     (Strong)
    Binarity Total Evidence Indicator  :        0.94     (Strong)

    Orbital & Binding Dynamics         :      d_proj  to      d_crit
    ----------------------------------------------------------------
    Spatial Separation Range           :          64  to         356  au
    Est. Orbital Period Range          :      336.60  to     4392.60  years
    Escape Velocity Range              :        6.96  to        2.96  km/s
    Circular Orbital Velocity Range    :        4.92  to        2.09  km/s
    Binding Indicator η Range          :        0.18  to        1.00
      η < 0.5 : Strongly bound / 0.5 ≤ η ≤ 1.0: Bound / η > 1.0 : Unbound


    UWLE for Tight Binaries (2D)       :
    ===================================
    TBS: Velocity Evidence Indicator   :        0.88     (Strong)
    TBS: Distance Evidence Indicator   :        1.00     (Strong)
    Binarity Total Evidence Indicator  :        0.94     (Strong)

    Orbital & Binding Dynamics         :      d_proj  to      d_crit
    ----------------------------------------------------------------
    Spatial Separation Range           :          64  to         356  au
    Est. Orbital Period Range          :      336.60  to     4392.60  years
    Escape Velocity Range              :        6.96  to        2.96  km/s
    Circular Orbital Velocity Range    :        4.92  to        2.09  km/s
    Binding Indicator η Range          :        0.18  to        1.00
      η < 0.5 : Strongly bound / 0.5 ≤ η ≤ 1.0: Bound / η > 1.0 : Unbound
    Separation (au)  Orbital Period (1 + 1 M☉)   (5 + 5 M☉) [years]
    ----------------------------------------------------------------
      100                707                                316
      500               7906                               3535
     1000              22361                              10000
     2500              88388                              39528
     5000             249444                             111803
    10000             707107                             316228
    25000            2775042                            1240347
    50000            7905694                            3162278
    ----------------------------------------------------------------
This section evaluates the chemical consistency of the star pair. Stars originating from the same progenitor cloud (co-natal stars) usually exhibit very similar iron abundances ([M/H]).
Interpreting the Results
    0.0 - 2.0 σ : Consistent (Likely shared origin)
    2.0 - 3.0 σ : Marginal (Possible match, but requires further evidence)
    > 3.0 σ     : Significant difference (The pair is likely composed of unrelated field stars)
    ≥ 5.0 σ     : Highly significant difference (Physical connection is very unlikely)
    Metallicity (Gaia DR3, GSP-Phot)      :
    ---------------------------------------
    Metallicity Star A - [M/H]         :     -0.0427  ± 0.1198 dex
      Metallicity reliability factor A :        0.95
    Metallicity Star B - [M/H]         :      0.1444  ± 0.0117 dex
      Metallicity reliability factor B :        1.00
    Metallicity Difference             :      0.1871           dex
    Combined uncertainty               :      0.1204           dex
    Sigma-Distance (Z-Score)           :      1.55 σ
      Compatibility                    :  Consistent (good agreement)

    -- Experimental module – results are preliminary and not validated --
The Double Star Calculator estimates the probability of a star being part of a binary system based on the RUWE parameter, using the following mapping:
RUWE              | Probability
-------------------------------
Ruwe > 5          | Very high
Ruwe < 5          | High
Ruwe < 3          | Medium
Ruwe < 1.4        | Low
Ruwe < 1.25       | Zero
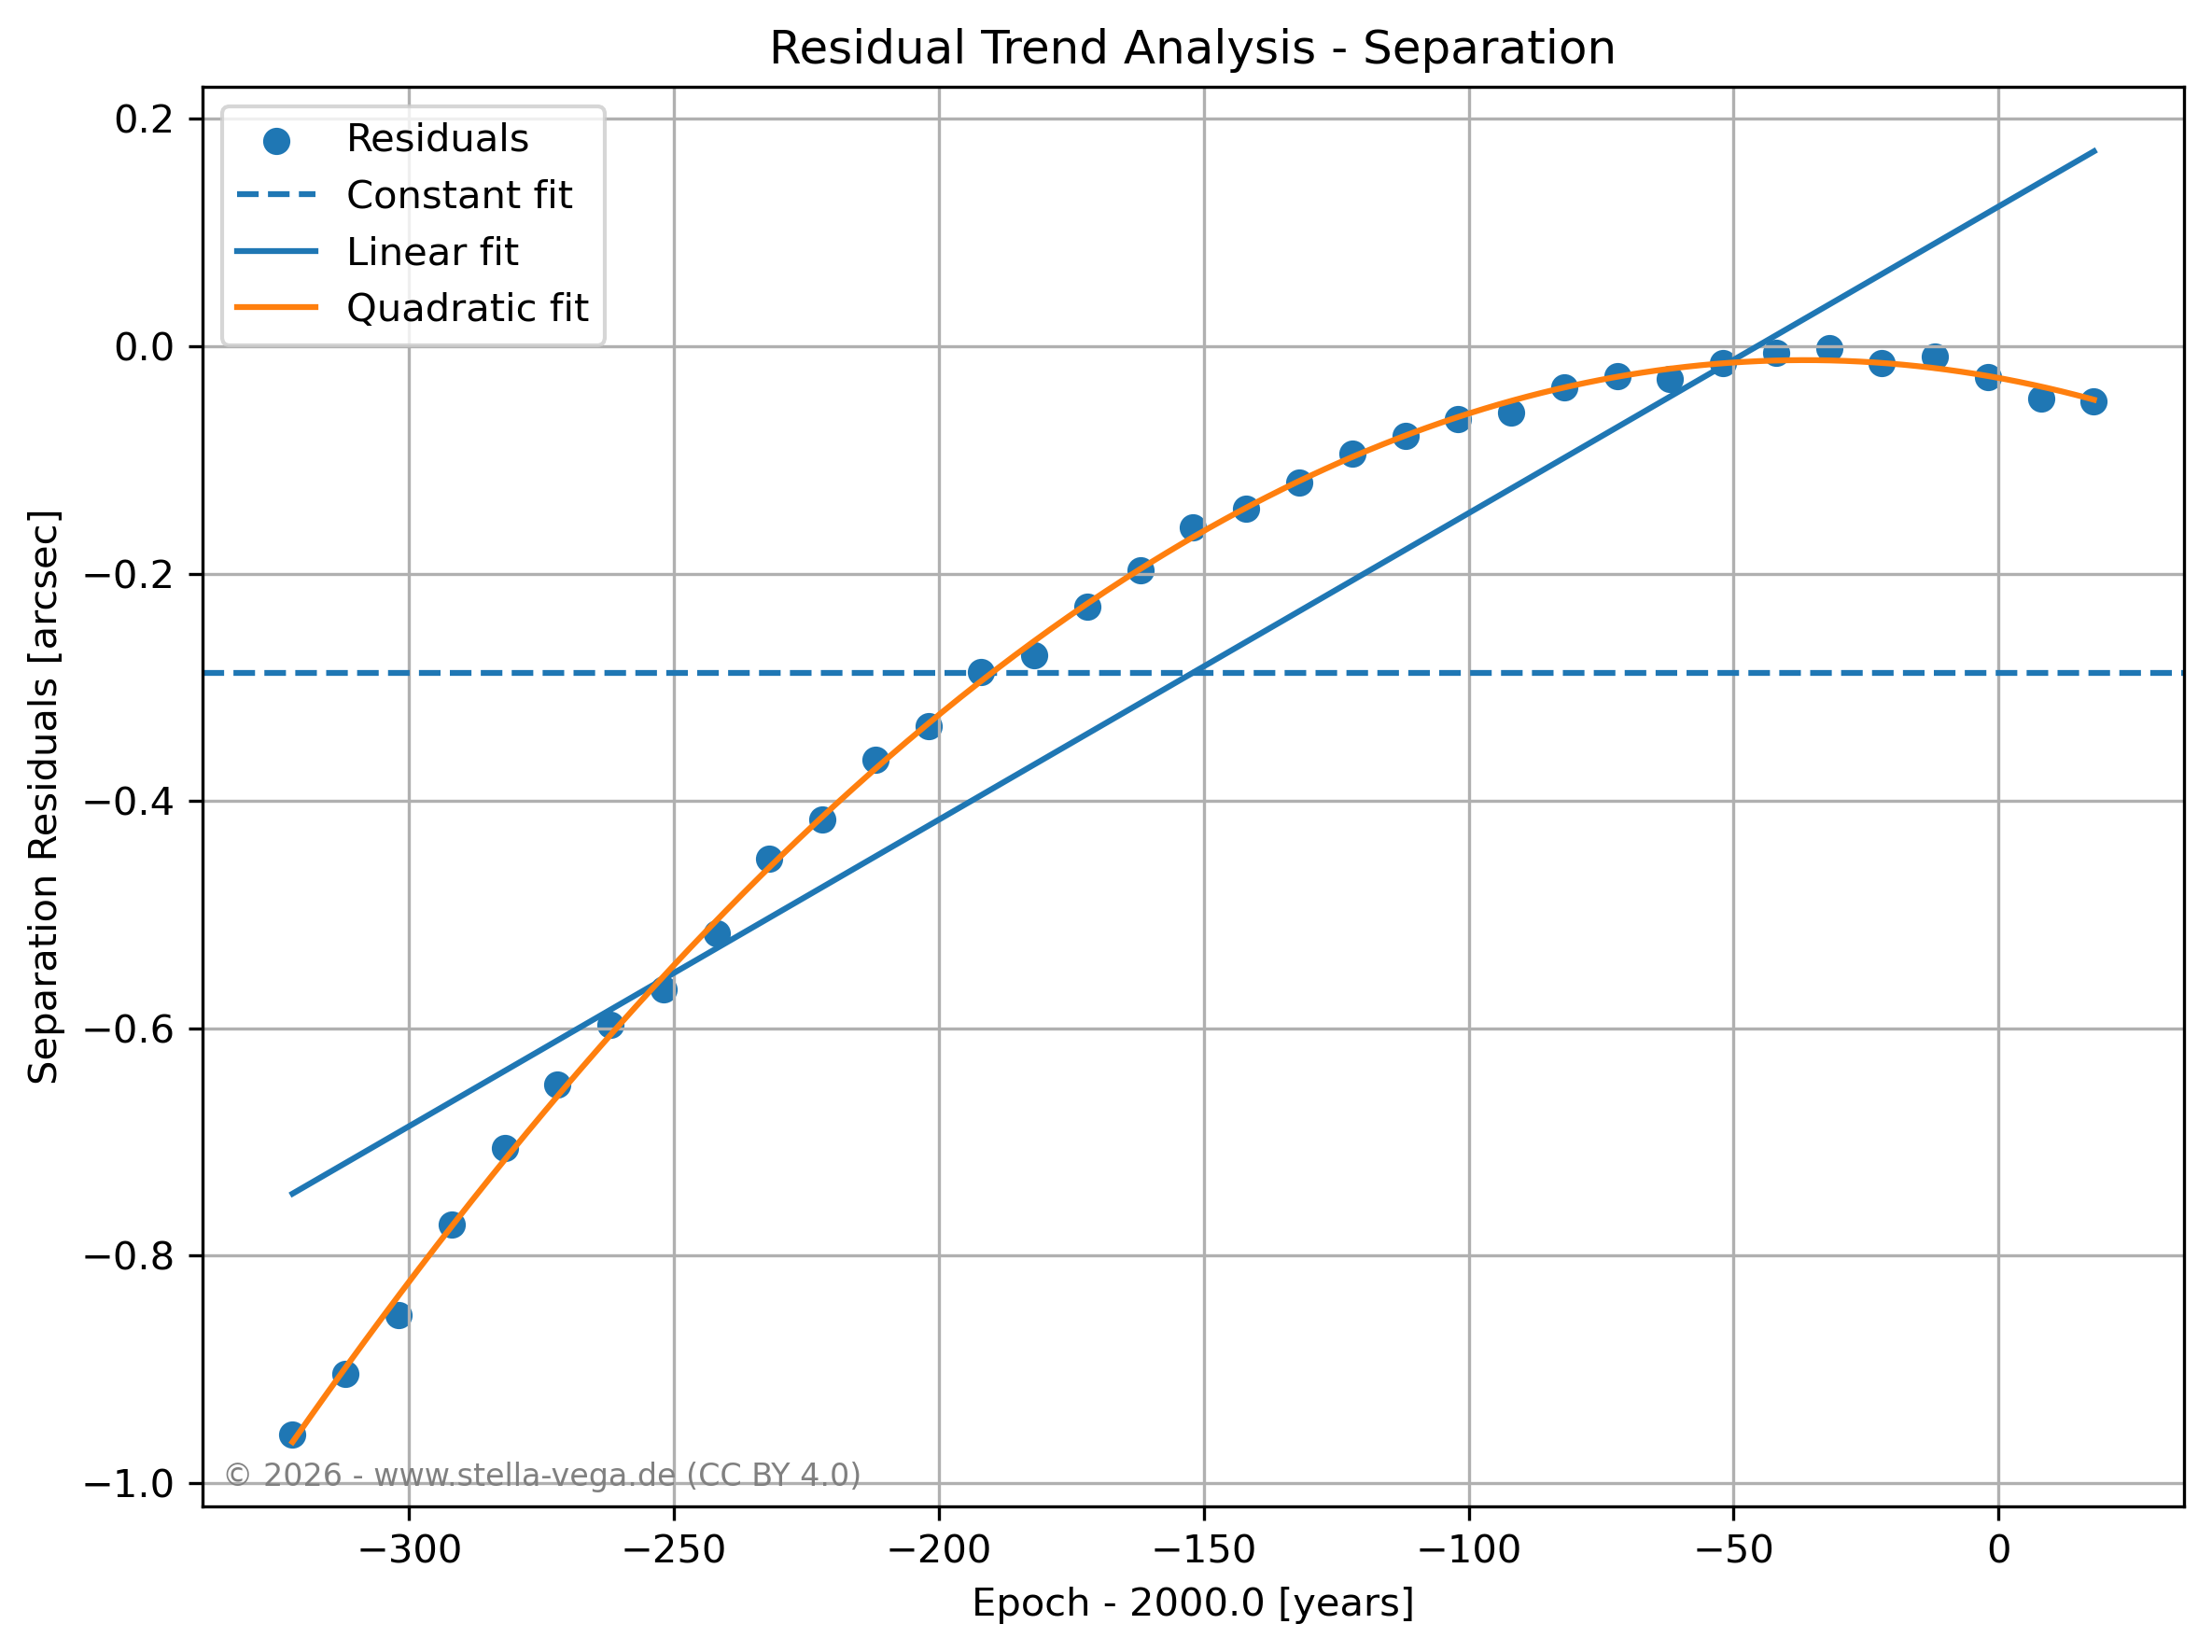
By processing the historical data, the Double Star Calculator calculates the exact residuals between those records and the Gaia kinematic motion predicted model. Additionally, it evaluates three different trend scenarios against these residuals: a constant offset, a steady linear drift, and a curved quadratic acceleration.
By analyzing the calculated baseline statistics and the generated trend lines, it is possible to determine whether the residuals are simply the result of random measurement noise and catalog calibration errors, or if the binary system exhibits real physical changes over time, such as orbital acceleration caused by a companion star.
USNO Double Star data for WDS 07444+2424

Note: the data request software was rewritten in July 2017, following introduction of the WDS supplement. Please see the
new datarequest.key file for a description of file contents. This effort is still ongoing; your comments regarding
format, errors, or missing information are welcome.

------------------------------------------------------------------------------------------------------------------------

MEASURES:

STT 179      1827 2021   92 240 243   5.0   7.0  3.66 10.0  G8IIIa    -033-052          +24 1759 N    074426.87+242353.3
       1827.       240.      .       5.        .         .     .     10.     .                0.5   1 HJ_1829a Mb   7
       1832.17     225.2     .       6.25      .        4.     .     12.     .                0.1   1 Da_1835  Ma   4
       1838.98     231.9     .       6.0       .         .     .       .     .                0.2   1 Smy1844  Ma   6
       1841.20     232.7     .       6.18      .         .     .       .     .                0.2   1 Da_1867  Ma   4
       ...         ...               ...
Because the RMSE squares the residuals before averaging, a significantly larger RMSE compared to the MAE indicates the presence of relatively large residuals (outliers) or a heavy-tailed residual distribution.
Very similar MAE and RMSE values indicate a relatively homogeneous residual distribution without pronounced outliers.
For a normal distribution with zero mean: RMSE ~ 1.25 * MAE
A significantly larger RMSE compared to the STDEV indicates the presence of a systematic offset (bias). The residuals are not centered around zero but are shifted toward positive or negative values (e.g. due to calibration errors)
Very similar RMSE and STDEV values indicate that the residuals have little or no systematic offset (bias). Positive and negative residuals balance each other and the observed error is primarily due to random scatter/noise.
This test is used to detect first-order autocorrelation in the residuals of a regression analysis. The calculated value ranges from 0 to 4, where a value around 2 indicates no evidence of autocorrelation.
| DW Value | Interpretation |
|---|---|
| ≈ 2.0 | No evidence of first-order autocorrelation in the residuals. The residuals are consistent with random noise under the assumption of the Gaia-based linear motion predicted model. |
| < 1.5 | The residuals show positive autocorrelation. This indicates that the motion predicted Gaia model does not fully capture the underlying trend. Such behavior may indicate non-linear motion components (e.g. orbital motion) or systematic effects in the data. |
| ≥ 2.5 | The residuals show negative autocorrelation, indicating oscillation. Positive residuals tend to be followed by negative ones, creating a zig-zag structure. This is a rare case and may suggest data processing artifacts, overcorrection or inconsistencies in the original measurements. |
| Model | Interpretation |
|---|---|
| Constant | Reflects the scatter of the data relative to the mean position. A high RMS suggests significant apparent motion of the star relative to a constant offset model. |
| Linear |
Reflects the remaining error after accounting for constant velocity (rectilinear motion). If the RMS in the Linear model decreases significantly compared to the Constant model, a steady relative motion is present. A minimum RMS in the Linear model may be consistent with uniform relative motion, as expected for an optical double star. |
| Quadratic |
Reflects the remaining error after accounting for accelerated motion (curvature). A substantial reduction in RMS from the Linear to the Quadratic model may suggest the presence of non-linear motion components, potentially consistent with orbital motion. |
| DW Value | Interpretation |
|---|---|
| ≈ 2.0 |
The residuals are uncorrelated and consistent with statistical independence under the given model. The chosen model is consistent with the trend in the data, e.g. linear (proper motion) or quadratic (curvature) motion components. Remaining deviations are related to noise. The model represents the data with good statistical consistency.
|
| < 1.5 | The positive autocorrelation reflects a significant residual trend, the used model is frequently under-specified. The data contains non-linear motion. If e.g. a linear model was used, this suggest an uncaptured physical component such as orbital acceleration. Small DW values between the Constant and Linear model indicate the presence of a significant linear trend in the data that is not captured by the simpler model. |
| ≥ 2.5 | The residuals show negative autocorrelation, indicating unusual oscillation. Positive and negative residuals create a kind of zig-zag pattern. This is a rare case and may suggest issues in the data processing, overcorrection, or inconsistencies in the original measurements. |
Mean Absolute Error              :   0.286948         arcsec
Bias Error                       :  -0.286948         arcsec
Root Mean Square Error           :   0.409752         arcsec
Standard Deviation               :   0.296772         arcsec
Durbin-Watson Test               :   0.007701

----------------------------------------------------------------
Constant model  ( r(t) = a )
----------------------------------------------------------------
a (offset)                       :  -0.286948         arcsec
RMS                              :   0.292502         arcsec
Durbin-Watson Test               :   0.015112

----------------------------------------------------------------
Linear model  ( r(t) = a + b*t )
----------------------------------------------------------------
a (offset)                       :   0.122933         arcsec
b (velocity)                     :   0.002697         arcsec/yr
RMS                              :   0.106710         arcsec
Durbin-Watson Test               :   0.052581

----------------------------------------------------------------
Quadratic model  ( r(t) = a + b*t + c*t² )
----------------------------------------------------------------
a (offset)                       :  -0.027824         arcsec
b (velocity)                     :  -0.000855         arcsec/yr
c (acceleration)                 :  -0.000012         arcsec/yr²
RMS                              :   0.007371         arcsec
Durbin-Watson Test               :   1.846791
Finally, the Gaia data records used to calculate the results are displayed. By default, these records are collapsed. To view them, simply expand the section. Additionally, if the discoverer code and number were provided, the corresponding entry from the USNO WDS catalog is shown.
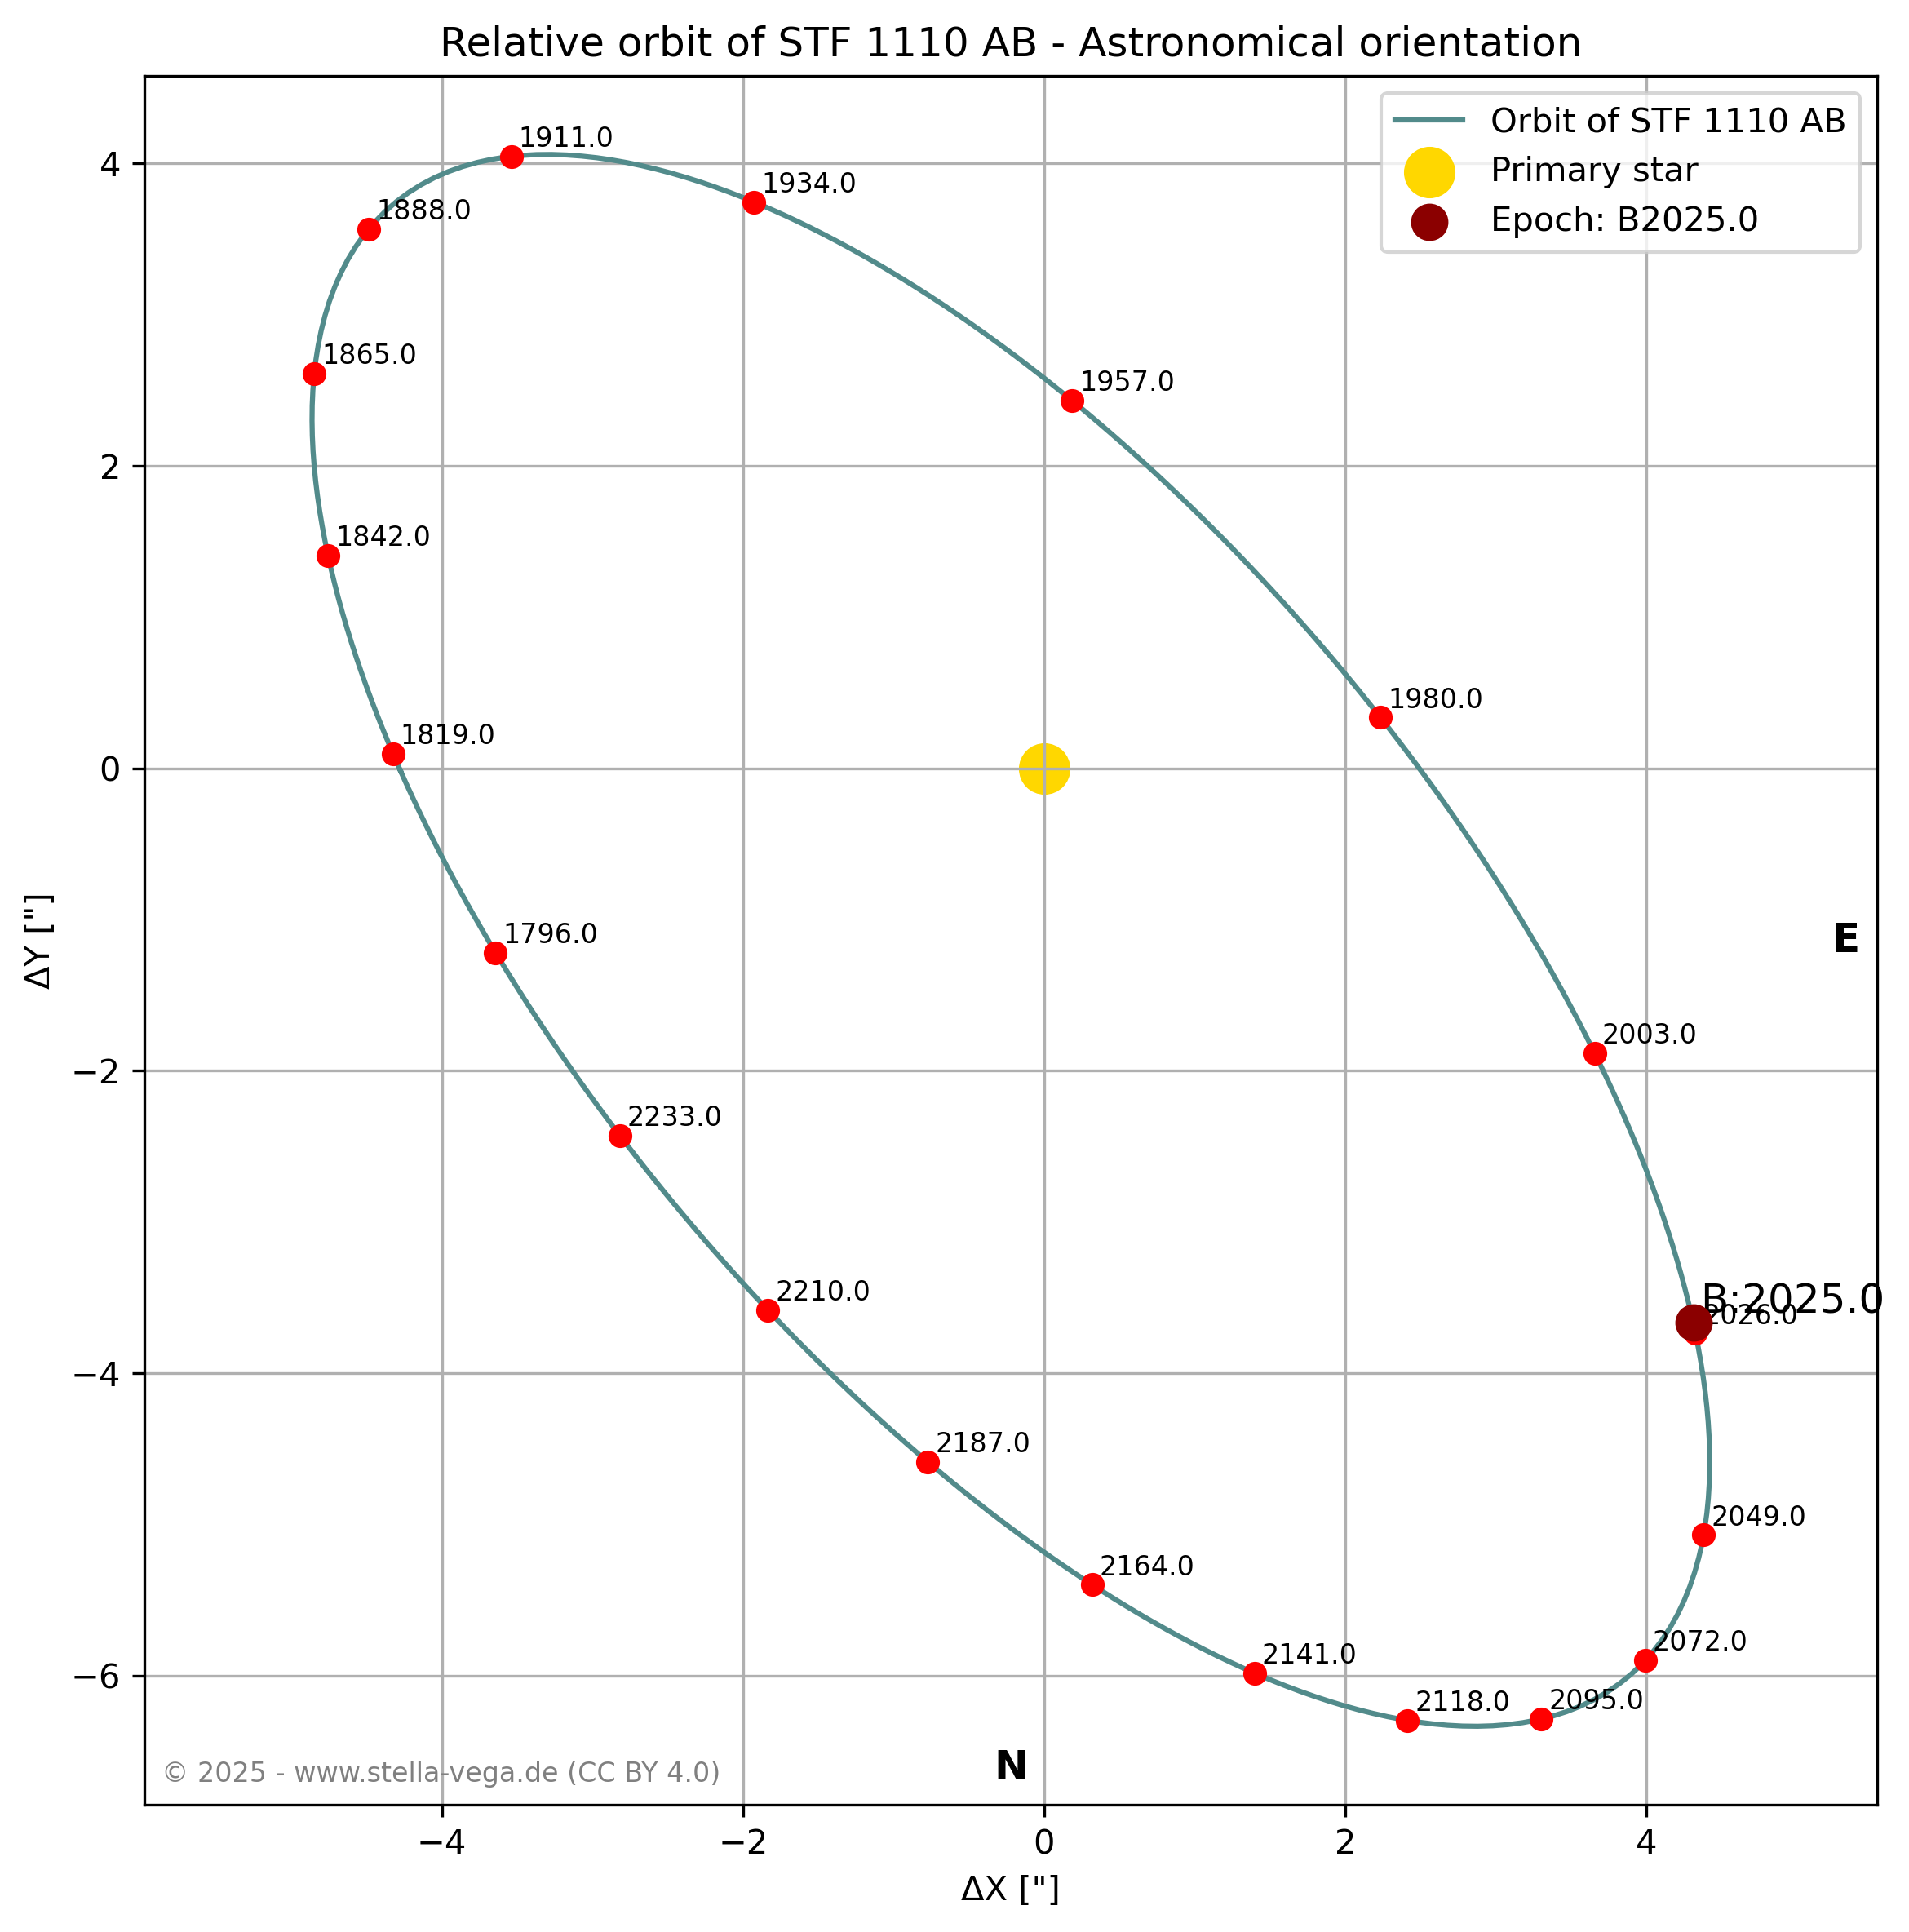
The Double Star Calculator – Orbital Elements generates an orbit diagram and a corresponding ephemeris table showing separation and position angle of a double star based on orbital elements.
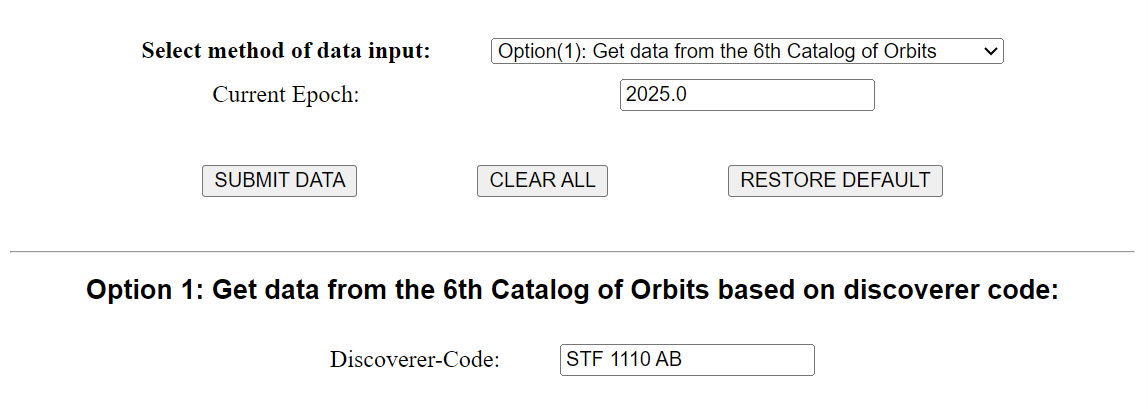
There are two ways to calculate the ephemeris and generate the orbit diagram. The easiest method (Option 1) is to enter the discoverer code of a double star listed in the WDS Sixth Catalog of Orbits of Visual Binary Stars and click the [SUBMIT DATA] button. The tool will search the catalog for the discoverer code and, if a matching entry is found, extract the necessary data and calculate the orbit. The orbit and ephemeris are automatically calculated for a full orbit.
The field Current Epoch is used to calculate an ephemeris entry for the specified epoch. If the Current Epoch field is left empty, the system date will be used instead.
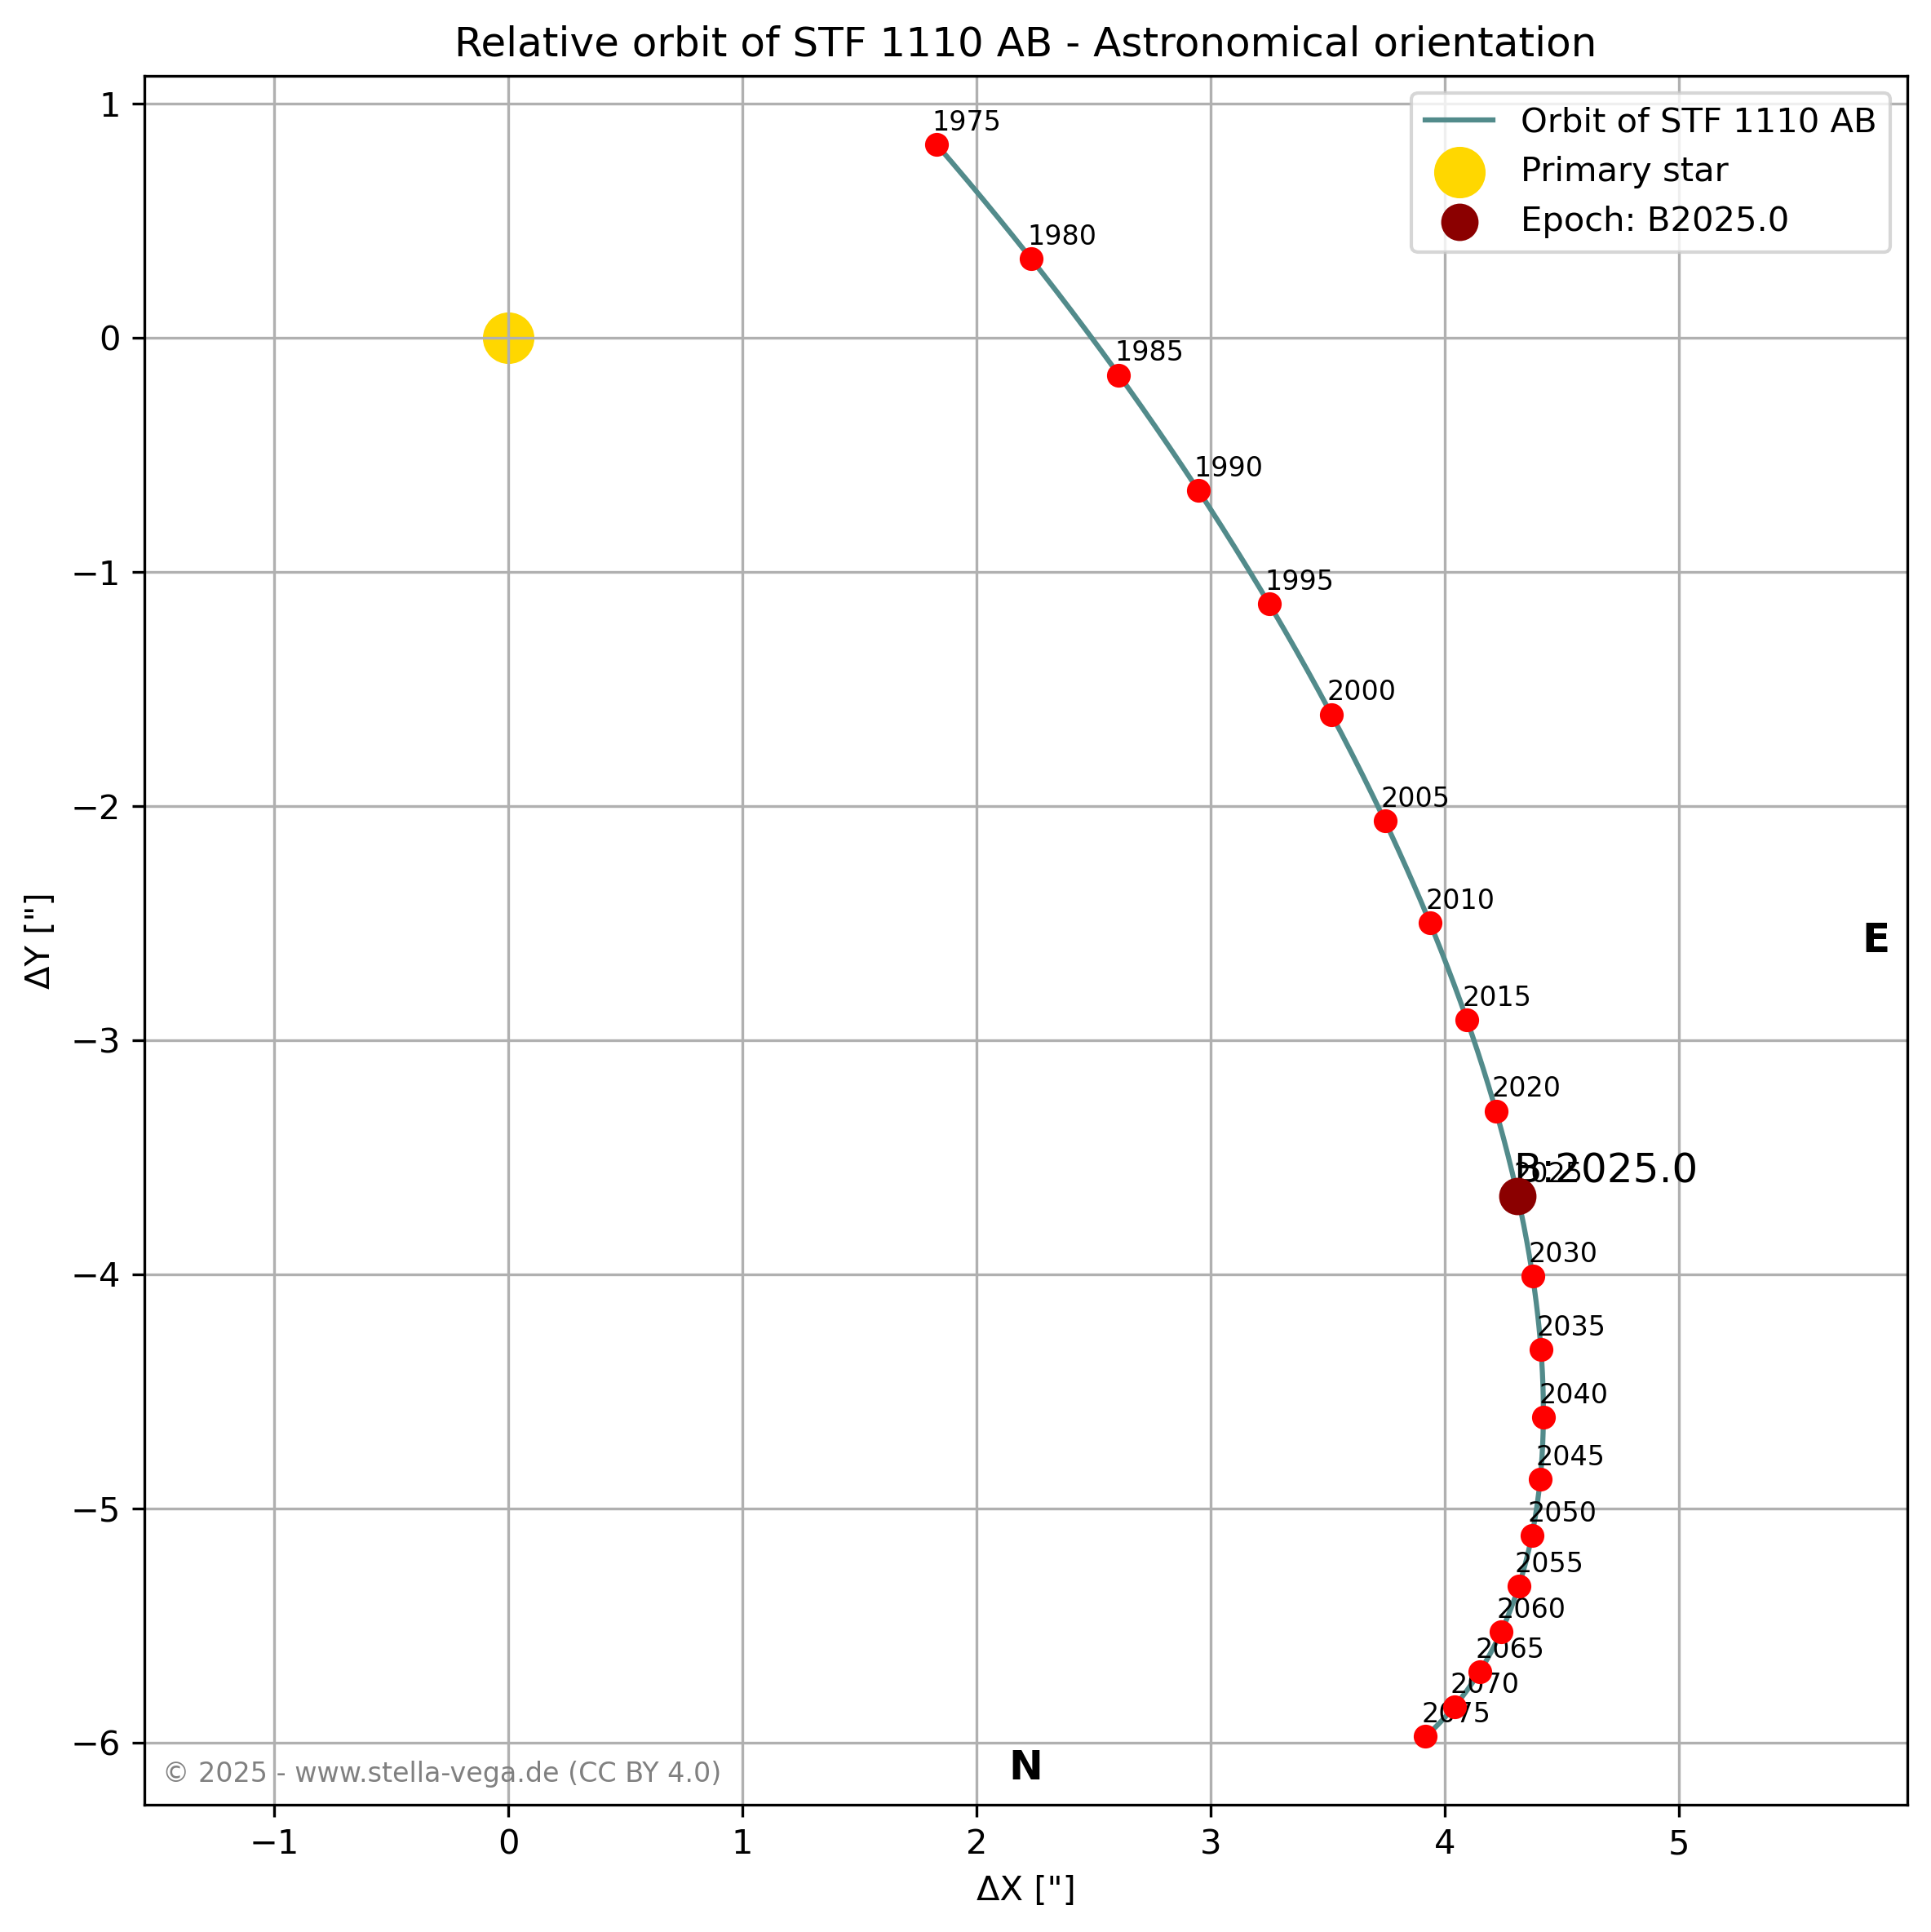
Simply press [SUBMIT DATA] to see how the tool works using the default data for the double star STF 1110 AB (Castor). Use [CLEAR ALL] to empty the input fields and prepare for new orbital elements, or click [RESTORE DEFAULT] to reload the default data.
The alternative method (Option 2) is to manually enter all required data into the form below. This offers greater flexibility regarding the input. If the fields Start year and End year are not set, the orbit and ephemeris are automatically calculated for a full orbit. By setting Start year and End year, parts of the orbit can also be calculated with higher precision. Press the [SUBMIT DATA] button to start the calculation.

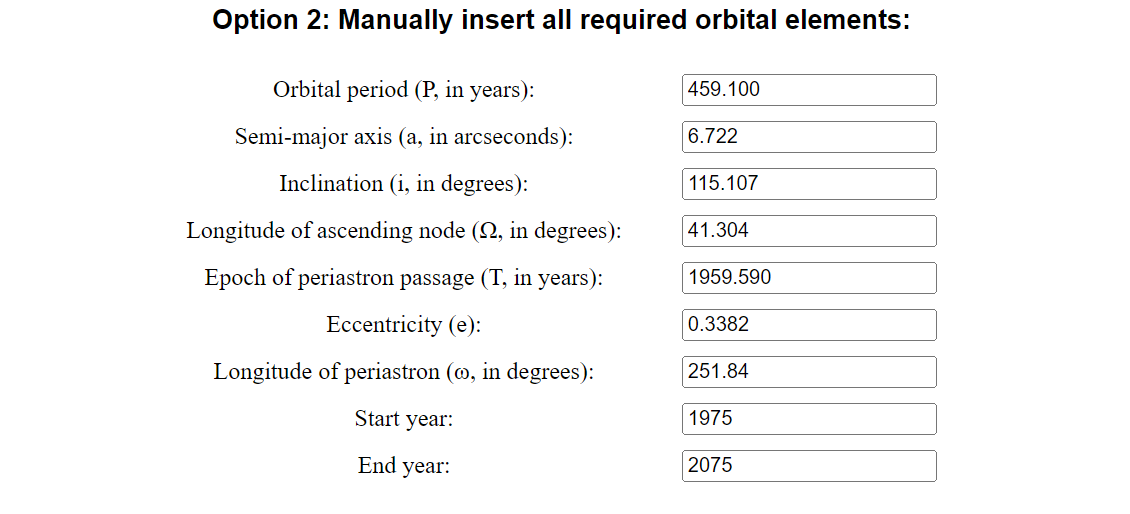
If Option 1 is selected and orbital elements are also entered in the fields of Option 2, the manually entered elements will overwrite those retrieved from the Sixth Catalog. This feature provides greater flexibility and is useful to adapt certain orbital elements if measurements do not fit the calculated orbit.
The optional Advanced Settings for Orbital Calculations can be used to control the calculation of ephemerides and their presentation in orbit diagrams. Start Year and End Year define the calculation interval; by default (auto), one complete orbital period is used. Ephemeris Interval defines the calculation granularity of the ephemerides, while Plot Epoch Interval defines the spacing of epoch markers in the orbit diagrams. By default, these two settings are calculated and optimized automatically based on the specified orbital elements. Nevertheless, it may be useful to override these automatically determined values in order to improve the presentation of the orbit diagrams or the granularity of the calculated ephemerides.

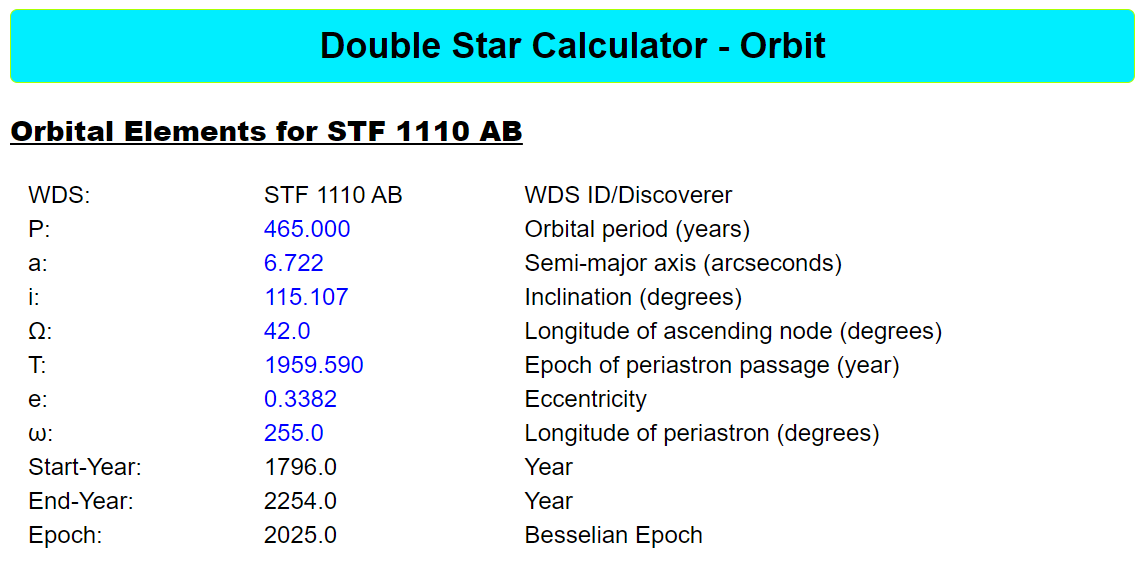
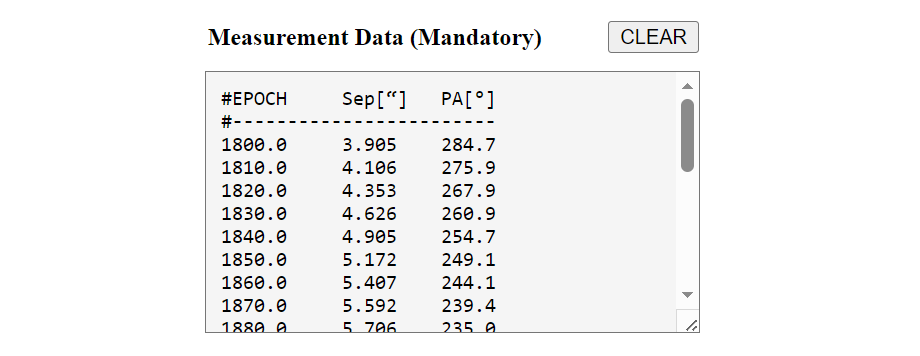
The Double Star Calculator – Orbit Determination processes historical measurements of the separation and position angle of a double star to determine its orbital elements. The calculation requires a list of historical measurements. The Measurement Data field expects the data in the format provided by the USNO. Currently, only the Epoch, Position Angle, and Separation columns are extracted and used for the orbit determination. The first measurement record must begin on line #12 (counting from line #1). Any trailing lines following the last measurement should be removed before processing. For details regarding the format of the measurement data and the handling of measurement errors, refer to the chapter Definition and Processing of Measurement Errors in the documentation.
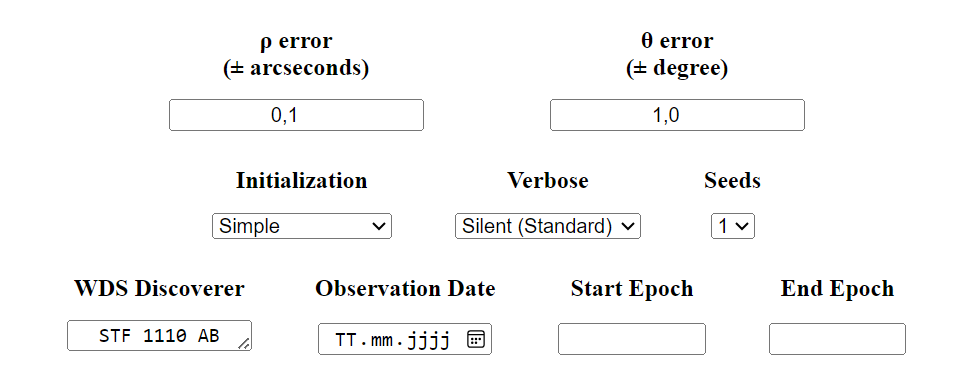
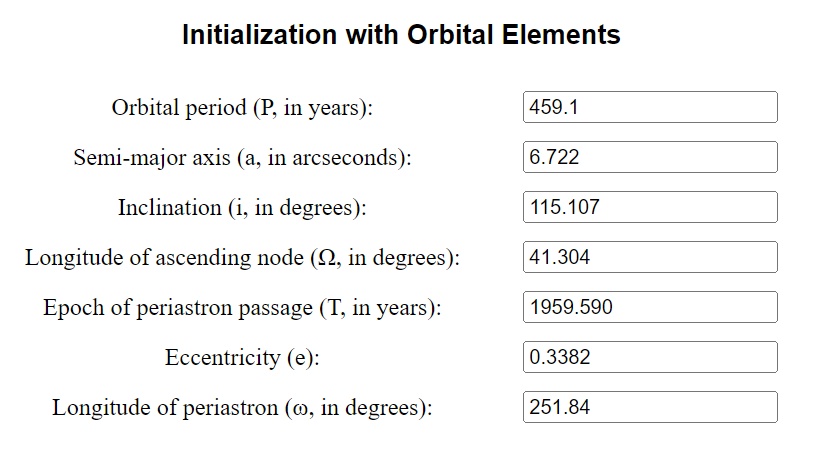
The parameter section Initialization with Orbital Elements is enabled if the Initialization parameter is set to Orbital Elements. In this case, the entered orbital elements are used as an initial guess for orbit determination. This is, for example, useful for refining an existing orbital solution.
Important note:
The number of measurements and the number of selected seeds have a significant impact on the processing time, which may take up to several minutes.

The Verbose verbose level adds the bounds for the orbital elements and the initial guess used for the calculation. The highest verbose level, Very Verbose, adds further details to the report in an expandable box, specifically internal details and intermediate results of the orbit calculation.
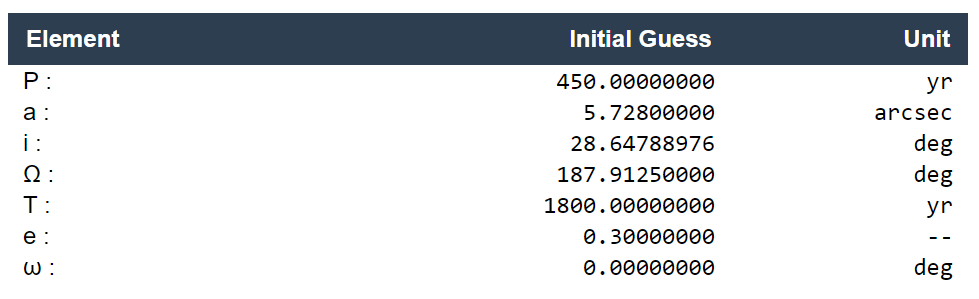
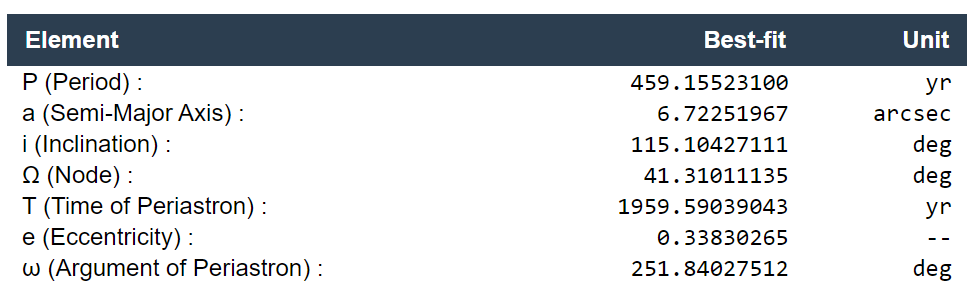
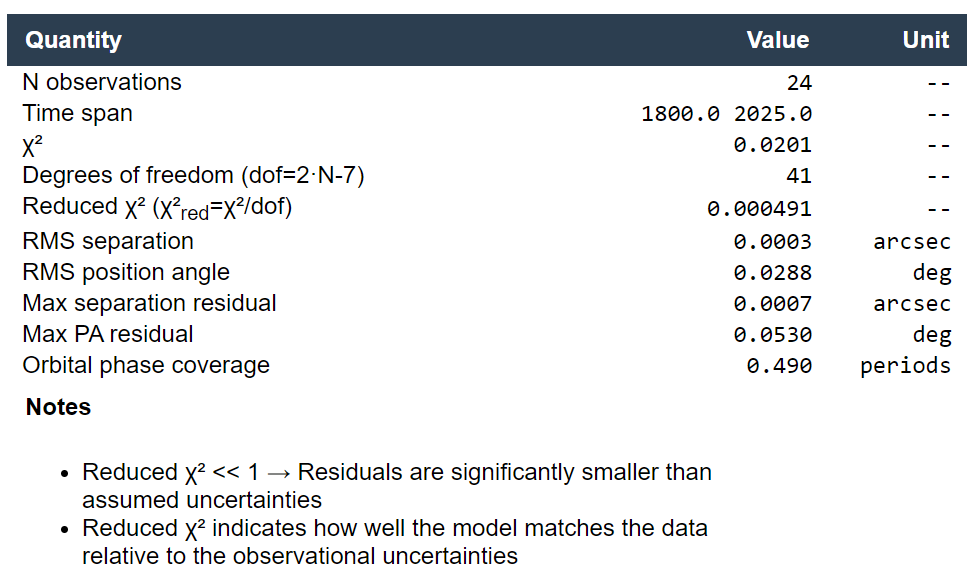
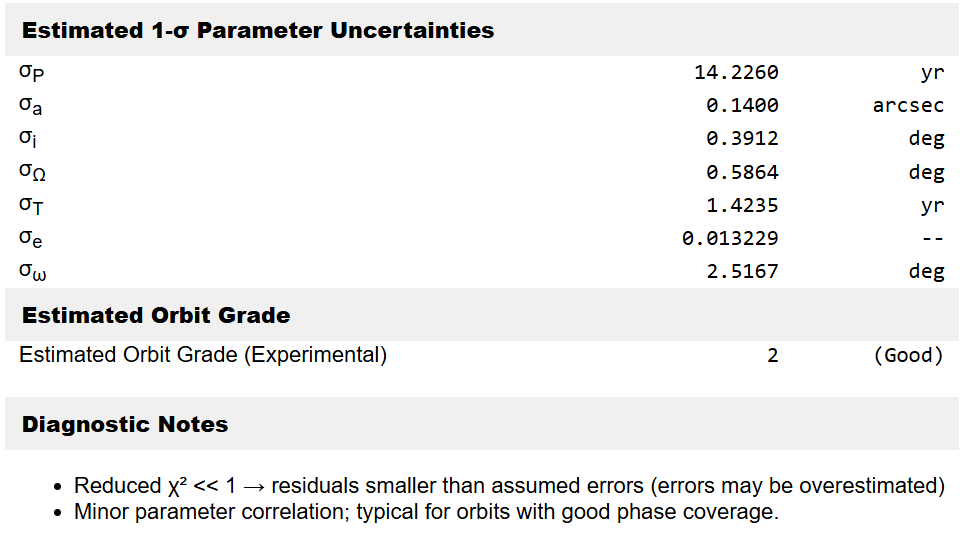
The Optimization Summary provides quantitative measures describing the quality, robustness, and statistical consistency of the orbit determination based on the supplied observations and measurement uncertainties. It should be interpreted as a whole. Individual metrics are most meaningful when considered together, particularly in relation to the number of observations, the orbital phase coverage, and the assumed measurement uncertainties.
Number of observations used in the orbit determination. Each observation consists of a measured separation (ρ) and position angle (θ), contributing two residuals (x and y) to the fit.
Time interval covered by the observations, defined by the minimum (Tmin) and maximum (Tmax) observation epochs. A larger time span generally improves orbit determination, especially for long-period systems, as it increases orbital phase coverage.
Fraction of the orbital period covered by the observations, where P is the fitted orbital period. Values close to or exceeding one full period generally provide stronger constraints on the orbital elements, while smaller values indicate limited phase coverage and potential parameter degeneracies.
The total chi-squared value of the fit, defined as the sum of squared, uncertainty-weighted residuals. χ² measures the overall disagreement between the model and the observations.
Number of independent residuals available to evaluate the fit after accounting for the fitted model parameters. A positive and sufficiently large number of degrees of freedom is required for a meaningful statistical interpretation of χ² and reduced χ².
The reduced χ² indicates how well the orbital model matches the observations relative to the assumed measurement uncertainties.
Indicates whether the numerical optimization converged: (Converged or Not converged).
The condition number () of the covariance matrix quantifies the numerical stability of the inversion and parameter correlations during the fit. It serves as a scalar measure for the numerical stability of the linear inversion and the degree of parameter correlation. Higher values indicate stronger parameter degeneracy or ill-conditioning.
Root-mean-square (RMS) residual of the separation (ρ), calculated from the differences between observed and modeled separations. This value quantifies the typical deviation of the observations from the model.
Root-mean-square (RMS) residual of the position angle (θ), calculated from the differences between observed and modeled angles. The RMS position angle is given in degrees and reflects the typical angular discrepancy between the model and the observations.
The Weighted Root Mean Square (WRMS) residuals account for varying measurement uncertainties. Each residual is weighted by the inverse of its individual observational error (σ), ensuring that high-precision measurements (e.g., modern interferometry or space-based astrometry) have a stronger influence on the overall quality assessment than historical visual observations with higher uncertainties.
The root-mean-square (RMS) of position angle residuals projected into spatial arc length by multiplying the angular offset (in radians) by the observed separation .
Maximum absolute residual of the separation (ρ). This value highlights the largest individual deviation between an observed separation and the corresponding model prediction.
Maximum absolute residual of the position angle (θ). This value highlights the largest individual deviation between an observed position angle and the corresponding model prediction.
Formal 1- standard uncertainties for the 7 fitted orbital elements.
The Estimated Orbit Grade on a scale from 1 (Definitive), 2 (Good), 3 (Reliable), 4 (Preliminary) to 5 (Indeterminate). This classification scheme is conceptually aligned with the grading system used in the USNO Sixth Catalog of Orbits of Visual Binary Stars.
Automated health flags and diagnostic messages evaluated during orbit optimization to highlight numerical instabilities, data coverage limitations, or statistical anomalies.
Double stars are characterised by the separation ρ (RHO), the distance between the components measured in arc seconds ["] and the position angle θ (THETA), measured in degrees [°] from 0°..360°, starting in the north via east, south and west. The origin is the brighter component.
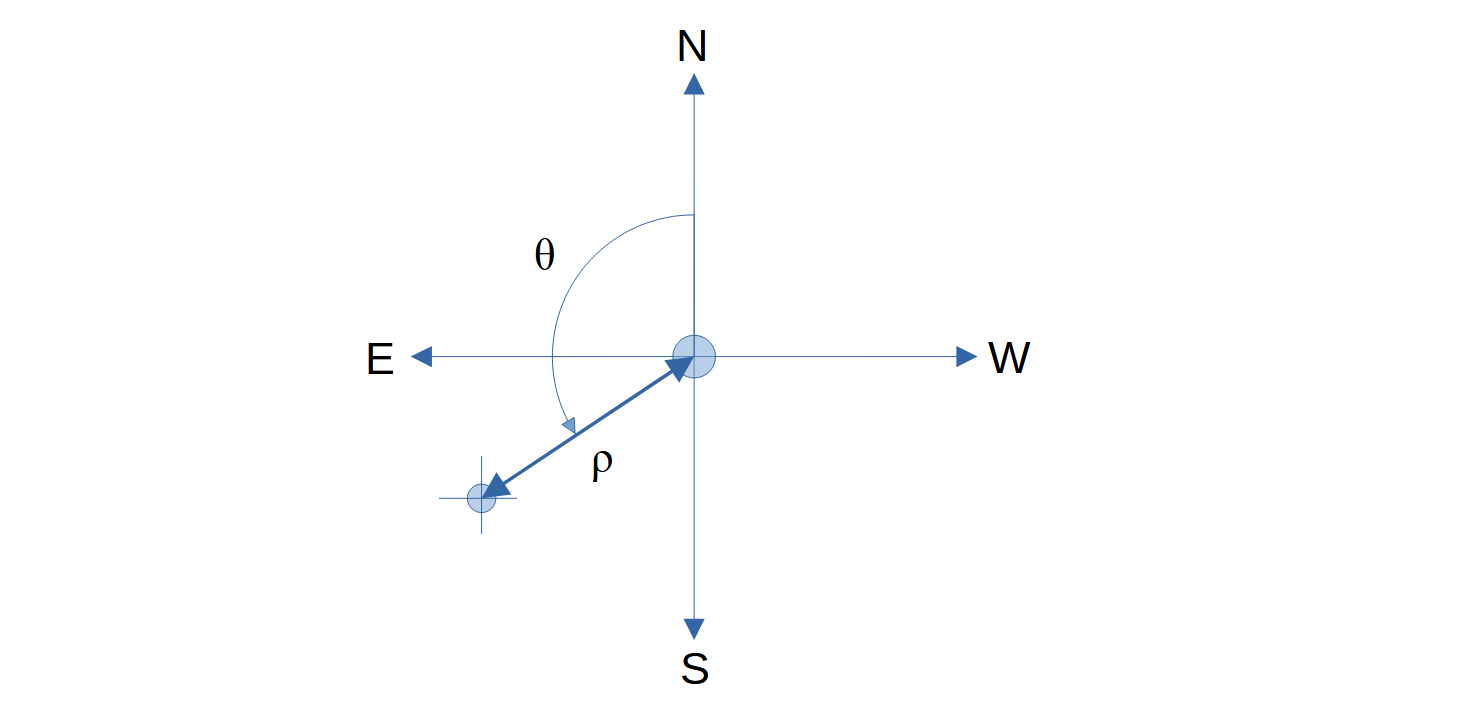
A distinction is made between optical and physical double or multiple stars. The former are stars that only happen to be in a line of sight, but are far behind each other in three-dimensional space and are not gravitationally bound. Physical binary and multiple stars are gravitationally bound.
Physical double stars can be divided into different categories. Visual double stars can be separated and measured with the naked eye or optical aids (binoculars, telescope). Spectroscopic double stars are so close together that they can no longer be separated with optical aids, but are noticeable in the spectrum through Doppler shifts. If the orbital plane of a double star system is aligned with the observer’s line of sight, one star may periodically pass in front of the other, causing mutual occultations similar to a solar eclipse. These occultations result in periodic variations in brightness, revealing the binary nature of the system. Such star pairs are known as eclipsing binaries. Finally, there are astrometric double stars, which only reveal themselves in the course of time due to a non-linear movement in the sky. Single stars have a constant motion in the sky, while astrometric double stars fluctuate periodically back and forth in their motion. Fluctuations in movement drew the attention of astronomers to Sirius B, for example.
To be distinguished from Double Stars are Common Proper Motion (CPM) Pairs. In addition to gravitationally bound double stars, there are pairs of stars known as Common Proper Motion (CPM) pairs. These are two or more stars that appear to move together through space, sharing the same proper motion. Unlike gravitationally bound systems, CPM pairs are not necessarily physically associated, and their apparent motion together is simply due to their being located along a similar line of sight or moving through space in the same direction. In contrast, gravitationally bound double stars follow more predictable orbital motions due to mutual gravitational attraction.
This chapter provides information and guidance on measuring the separation and position angle of double stars using amateur equipment and small telescopes with fairly high accuracy.
The content is available for download as a PDF document and is published under the Creative Commons license CC BY-NC-SA 4.0.
The document has been developed over several years and reflects my knowledge on the subject, primarily acquired during this time. Any errors or inaccuracies within the document are the responsibility of the author. Constructive feedback is always welcome and appreciated!
➔ Double Stars: Measurement of Distance and Position Angle with Small Telescopes
  Tool         Revision    Change
  -------------------------------------------------------------------------------------------------------------------------------------------------------------------
  DS-CALC      2591        Added calculation of 3D Space Velocity Angle and 3D Distance Probability Analysis
  DS-ORBITD    2547        Enhanced Definition and Processing of Measurement Errors for Orbit Fitting
  DS-ORBITD    2536        Complete review of Orbit Fitting routine incl. documentation
  DS-ORBITD    2516        Fixed Thiele-Innes Initial Guess Method
  DS-ORBIT     2397        Various fixes for specific 6th orbit catalog data, Version 1.2
  DS-CALC      2353        Added Residual Analysis
  DS-CALC      2261        Complete DSC Archive rebuilt
  DS-CALC      2254        Selected results of the Gaia DR3 table gaiadr3.astrophysical_parameters added
  DS-CALC      2250        Stellar Extinction added to calculation of Absolute Magnitude
  DS-CALC      2201        Enhanced UWLE by calculation of tight binaries (TBS)
  DS-CALC      2169        Evaluation of metallicity added (still experimental)
  DS-CALC      2096        Various fixes and updates added
  DS-CALC      1873        Changed formula for calculation of separation
  DS-CALC      1867        Two CPM evidence calculation methods added, acc. to Harshaw and acc. to DSC
  DS-CALC      1829        HRD added to DS-CALC
  DS-CALC      1747        Orbit determination improved, online help updated, WDS notes decoding added
  DS-ORBITD    1734        First off - orbit determination, online help updated
  DS-CALC      1703        Changed from WDS text file to SQL database
  DS-CALC      1692        Added separation, CPM, and binding evidence factors; calculation of projected separation based on the nearer star; style sheets introduced
  DS-CALC      1455        Bug fixes, bot/scanner protection improved
  DS-CALC      1378        Changed default double star to STF 1872 AB
  DS-CALC      1350        Improved search function in WDS DB
  DS-CALC       671        Initial release
www.stella-vega.de